|
XLPack for Matplotlib Experimental Version 0.1
Example Programs
|
Loading...
Searching...
No Matches
|
XLPack for Matplotlib Experimental Version 0.1
Example Programs
|
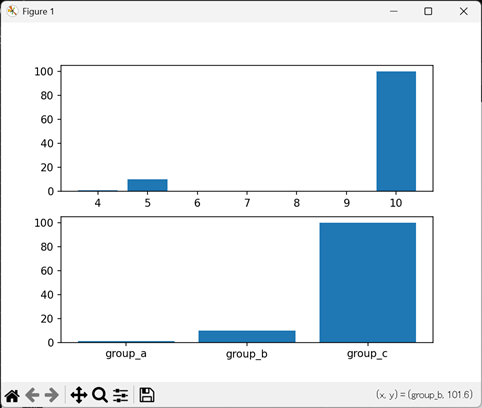
Displays data as a bar chart. Bar can be used when the horizontal axis represents numerical values, while Bar_str is used when the horizontal axis represents strings.
Sub Test_Bar()
    Const N = 3
    Dim X(N - 1) As Double, Xstr(N - 1) As String, Y(N - 1) As Double
    Dim I As Integer
    Dim Fig As Figure, Ax1 As Axs, Ax2 As Axs
    '-- Make data
    X(0) = 4: X(1) = 5: X(2) = 10
    Xstr(0) = "group_a": Xstr(1) = "group_b": Xstr(2) = "group_c"
    Y(0) = 1: Y(1) = 10: Y(2) = 100
    '-- Plot
    Set Fig = Plt.Figure()
    Set Ax1 = Fig.Add_subplot(2, 1, 1)
    Call Ax1.Bar(N, X(), Y())
    Set Ax2 = Fig.Add_subplot(2, 1, 2)
    Call Ax2.Bar_str(N, Xstr(), Y())
    Call Plt.Show
End Sub