
11. Numerical Integration
Note – This document was created using AI translation.11.1 Overview
Let (f(x)) be a function defined on the interval ([a,b]). The problem of approximating the definite integral
\[
I = \int_a^b f(x) dx
\]
is called “numerical integration” or “quadrature”.
Numerical integration programs can be broadly classified into two types. The first is the “function-input type”, in which the integrand is provided as a program that can evaluate the function at any point within the interval whenever requested. The second is the “data-input type”, in which the values of the integrand are given only as discrete data at a set of sampled points.
11.2 Basic Numerical Integration Formulas
We explain the basic ideas using the following example, in which the integral (I) is evaluated numerically.
\[
\begin{align}
& f(x) = e^x cos(x) \\
& I = \int_{0.2}^1 f(x) dx = 1.15816896857196 \\
\end{align}
\]
The simplest approach is to approximate the integral by the area of the trapezoid bounded by the straight line connecting the endpoints of the integration interval. The resulting formula is
\[
I = \frac{b – a}{2}(f(a) + f(b))
\]
This formula is called the “trapezoidal rule”.
Next, to obtain a more accurate approximation, we can use three points — the endpoints \(a\) and \(b\), together with the midpoint \(x_1 = (a + b)/2\) — and approximate the integral by the area under the parabola that passes through these three points. The resulting formula is
\[
I = \frac{b – a}{6}(f(a) + 4f(x_1) + f(b))
\]
This formula is called “Simpson’s rule”.
An even more accurate method than Simpson’s rule is the “Gaussian quadrature formula” (also known as “Gauss–Legendre quadrature”).
This method approximates the function by interpolating at the N zeros of the Legendre polynomial over the interval [a,b]. The resulting expression is given by as follows.
\[
I_N = \frac{b – a}{2} \sum_{i=1}^N w_i f(\frac{a + b}{2} + \frac{b – a}{2} x_i)
\]
The values of the nodes \(x_i\) and weights \(w_i\) are tabulated in many textbooks and mathematical handbooks. For N = 2 and 3, the values are given below. The formulas using these values are referred to as the “2 point Gaussian quadrature formula” and the “3 point Gaussian quadrature formula”, respectively.
\[
\begin{array}{ccccccc}
n & x_1 & x_2 & x_3 & w_1 & w_2 & w_3 \\ \hline
2 & -\sqrt{1/3} & \sqrt{1/3} & – & 1 & 1 & – \\
3 & -\sqrt{3/5} & 0 & \sqrt{3/5} & 5/9 & 8/9 & 5/9 \\
\hline
\end{array}
\]
Note that the nodes \(x_i\) do not include the endpoints \(a\) and \(b\) of the integration interval.
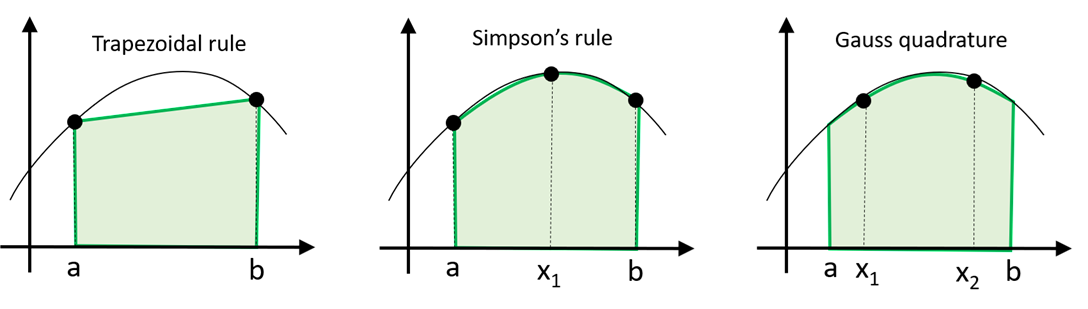
The three methods described above are illustrated in the following figure. For Gaussian quadrature, the case N = 2 is shown.
Next, we can divide the integration interval into several subintervals and apply the integration formula to each subinterval. This generally provides a more accurate approximation than applying the formula over the entire interval at once. Such methods are called “composite rules”. For example, as shown in the figure below, the integration interval is divided into four subintervals, and the trapezoidal rule is applied to each of them.
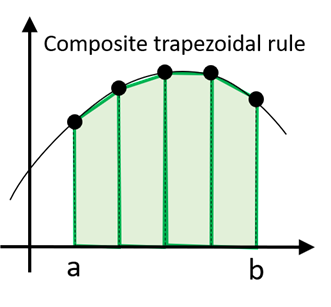
This method is called the “composite trapezoidal rule”. In practice, however, the composite version is used more frequently than the single-interval trapezoidal rule, so the term “trapezoidal rule” usually refers to the composite trapezoidal rule. The same convention applies to “Simpson’s rule”, which often means the “composite Simpson’s rule”.
When the integration interval is divided into m subintervals, the composite trapezoidal rule is given by
\[
I_m = h(\frac{f(x_0)}{2} + f(x_1) + f(x_2) + \dots + \frac{f(x_m)}{2}), \space h = \frac{b – a}{m}
\]
where, h denotes the width of each subinterval. In this discussion, h is assumed to be constant, although it is also possible to use variable subinterval widths.
Using these formulas, we can now evaluate the example introduced earlier. The results are shown below.
| Formula | Computed value | Relative error | Computational cost |
|---|---|---|---|
| Trapezoidal rule | 1.0663 | -7.9% | 2 |
| Simpson’s rule | 1.1575 | -0.06% | 3 |
| Gaussian quadrature (N = 2) | 1.15862 | 0.04% | 2 |
| Composite trapezoidal rule (m = 4) | 1.1523 | -0.5% | 5 |
It can be seen that the Gaussian formula, with a computational cost of 2, offers better accuracy than Simpson’s rule (computational cost of 3) or the composite trapezoidal rule (computational cost of 5).
11.3 Adaptive Quadrature
If integration error estimates are available, computations can be optimized by dynamically adjusting the number of subintervals, ensuring the required accuracy while minimizing computation cost. This approach is known as adaptive quadrature.
To estimate the error, one possible approach is to vary the number of subintervals and compare the results. When using the trapezoidal rule or Simpson’s rule with equally spaced subintervals, doubling the number of subintervals (halving the width of each) allows for the reuse of previously computed \(f(x)\) values at half of the points, thereby reducing computational cost.
In contrast, with the Gaussian quadrature formula, changing \(n\) requires recalculating \(f(x)\) at all points, making it computationally inefficient. To address this, the Gauss-Kronrod quadrature formula was proposed, allowing two different \(n\) values to be obtained within a single formula. The approach is as follows.
\[
I = \frac{b – a}{2}(\sum_{i=1}^n a_i f(\frac{a + b}{2} + \frac{b – a}{2}x_i) + \sum_{j=1}^{n+1} b_j f(\frac{a + b}{2} + \frac{b – a}{2}y_j))
\]
where \(a_i\) and \(b_j\) are Gauss-Kronrod quadrature coefficients. Do not confuse with the interval endpoints \(a\) and \(b\).
The \(x_i\) values are the same as those in the Gaussian quadrature formula. Therefore, by combining them with the weights \(w_i\) from the Gaussian quadrature, the integral value using the \(n\)-point Gaussian quadrature (denoted as \(G_n\)) can be obtained. Note that the values of \(a_i\) and \(w_i\) are different.
The integral value using the \((2n + 1)\)-point Gauss-Kronrod quadrature (denoted as \(K_{2n+1}\)) can be computed by the full formula.
\(K_{2n+1}\) has lower accuracy compared to \(G_{2n+1}\) despite having the same number of function evaluations for \(f(x)\). In other words, the Gauss-Kronrod quadrature formula introduces an error estimation feature at the cost of slightly reduced accuracy compared to the Gaussian quadrature formula.
For \(n = 2\) (5-point Gauss-Kronrod quadrature), coefficients are:
\[
\begin{array}{cccc}
\hline
x_i & -0.5773502691896258 & 0.5773502691896258 \\
a_i & 0.4909090909090909 & 0.4909090909090909 \\
y_j & -0.9258200997725515 & 0 & 0.9258200997725515 \\
b_j & 0.1979797979797980 & 0.6222222222222222 & 0.1979797979797980 \\
\hline
\end{array}
\]
From \(G_n\) and \(K_{2n+1}\), the integration error can be estimated.
Nowadays, numerical integration commonly employs adaptive quadrature routines to ensure a certain level of accuracy. In particular, programs that apply the Gauss-Kronrod quadrature formula to each subinterval for error estimation and optimize the width of each subinterval to reduce computational cost while maintaining accuracy are widely used.
11.4 Data Input Type Quadrature Programs
When the values of the integrand are available only at discrete data points, the integration formulas presented above are generally not applicable. However, if a sufficient number of equally spaced data points are provided, numerical integration methods such as the composite trapezoidal rule and Simpson’s rule can be used.
In general, the value of the integral is estimated by first interpolating the given data points and then integrating the resulting interpolation function.
Various interpolation methods are available, including polynomial interpolation and spline interpolation. In practice, however, the accuracy of the estimated integral depends strongly on the quality and distribution of the input data, and high accuracy cannot generally be expected.
11.5 Numerical Integration Using XLPack
The VBA subroutine Qk15 performs numerical integration using the 15-point Gauss-Kronrod quadrature formula, calculating the integral value and estimated error in 15 function evaluations. The VBA subroutine Qag is an adaptive quadrature routine based on the Gauss-Kronrod formula. If the function is smooth, Qk15 provides sufficient accuracy. However, if the function is not smooth or higher precision is required with more function evaluations, Qag is recommended.
For infinite-range integration, the VBA subroutine Qagi can be used. It also applies the adaptive Gauss-Kronrod quadrature formula, transforming semi-infinite integrals into finite interval integrals over [0, 1].
Both Qag and Qagi are accessible via the XLPack solver.
By combining the VBA subroutine Pchse or the worksheet function WPchse (see “5. Interpolation Methods”) with the VBA subroutine Pchia or the worksheet function WPchia, it can be used as a numerical integration program for data input type calculations.
In the following, we illustrate the numerical integration procedure by considering the computation of the following integral.
\[
\begin{align}
I = \int_0^4 \frac{1}{x + 1} dx = 1.6094379124341
\\
\end{align}
\]
11.3.1 How To Solve Using VBA Program (Function Input) (1)
An example using Qag and Qk15:
Function F(X As Double) As Double
    F = 1 / (1 + X)
End Function

Sub Start()
    Dim A As Double, B As Double, S As Double, Info As Long
    Dim AbsErr As Double, Neval As Long
    '--- Input data
    A = Cells(4, 2): B = Cells(5, 2)
    '--- Compute integration by Qag
    Call Qag(AddressOf F, A, B, S, Info, AbsErr, Neval)
    Cells(11, 2) = Info
    If Info = 0 Then
        Cells(8, 2) = S
        Cells(9, 2) = AbsErr
        Cells(10, 2) = Neval
    End If
    '--- Compute integration by Qk15
    Call Qk15(AddressOf F, A, B, S, AbsErr)
    Cells(8, 3) = S
    Cells(9, 3) = AbsErr
End Sub
An external function defines the integrand, while Qag and Qk15 compute the integral using the specified interval.
Executing this program gives the following results:
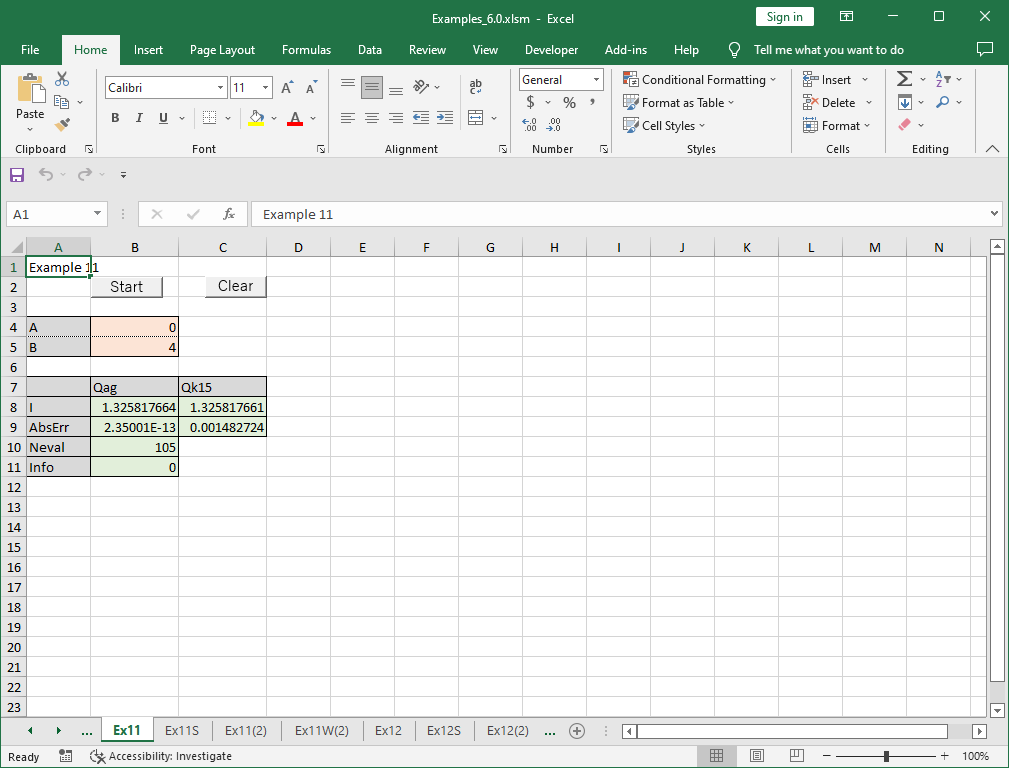
Qag produced a result with an estimated error of \(7.38 \times 10^{-13}\) after 75 function calls (internally calling Qk15 five times). Qk15 had an estimated error of \(2.07 \times 10^{-5}\) after 15 function calls. The estimated errors were calculated conservatively, and the actual errors were \(2.22 \times 10^{-16}\) and \(1.20 \times 10^{-11}\), respectively.
11.3.2 How To Solve Using VBA Program (Function Input) (2)
An example using Qag_r and Qk15_r (reverse communication interface):
Sub Start()
    Dim A As Double, B As Double, S As Double, Info As Long
    Dim AbsErr As Double, Neval As Long
    Dim XX As Double, YY As Double, IRev As Long
    '--- Input data
    A = Cells(4, 2): B = Cells(5, 2)
    '--- Compute integration by Qag_r
    IRev = 0
    Do
        Call Qag_r(A, B, S, Info, XX, YY, IRev, AbsErr, Neval)
        If IRev = 1 Then YY = 1 / (1 + XX ^ 2)
    Loop While IRev <> 0
    Cells(11, 2) = Info
    If Info = 0 Then
        Cells(8, 2) = S
        Cells(9, 2) = AbsErr
        Cells(10, 2) = Neval
    End If
    '--- Compute integration by Qk15_r
    IRev = 0
    Do
        Call Qk15_r(A, B, S, XX, YY, IRev, AbsErr)
        If IRev = 1 Then YY = 1 / (1 + XX ^ 2)
    Loop While IRev <> 0
    Cells(8, 3) = S
    Cells(9, 3) = AbsErr
End Sub
Here, the function values are computed inside the loop when IRev = 1, and then fed back into Qag_r or Qk15_r. More details on RCI are available here.
Executing this program produces the same results.
11.3.3 How To Solve Using Worksheet Functions (Data Input)
For data-based numerical integration, spline interpolation is used.
In the same example as above, the functional form is unknown, and only the function values at \(x = 0, 0.5, 1, \dots, 4\) are given.
\[
\begin{array}{cccc}
\hline
x & f(x) \\ \hline
0 & 1 \\
0.5 & 0.666667 \\
1 & 0.5 \\
1.5 & 0.4 \\
2 & 0.333333 \\
2.5 & 0.285714 \\
3 & 0.25 \\
3.5 & 0.222222 \\
4 & 0.2 \\
\hline
\end{array}
\]
First, use the WPchse function to determine the spline function coefficients (see “5. Interpolation”).
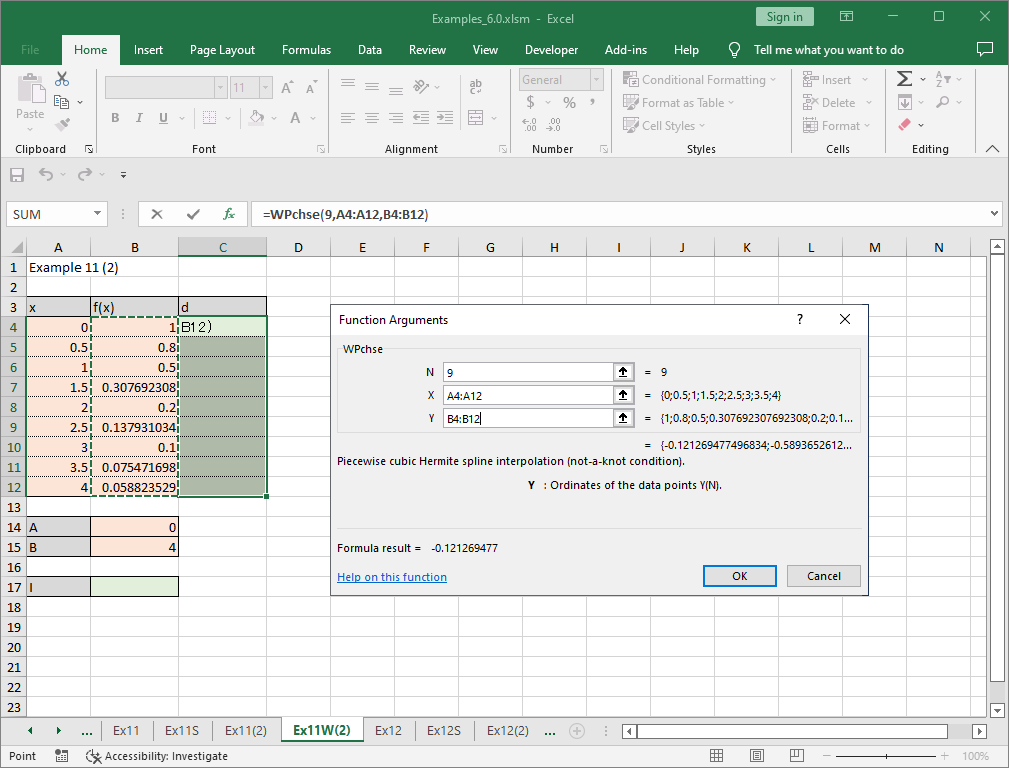
Once the coefficients have been obtained, the WPchia function can be used to calculate the integral value. The required parameters for WPchia are A, B, N, X, Y, and D. A and B represent the integration range (0 to 4 in this example). N is the number of data points (9 in this example). X and Y define the cell range for the interpolation data, while D specifies the cell range for the spline coefficients.
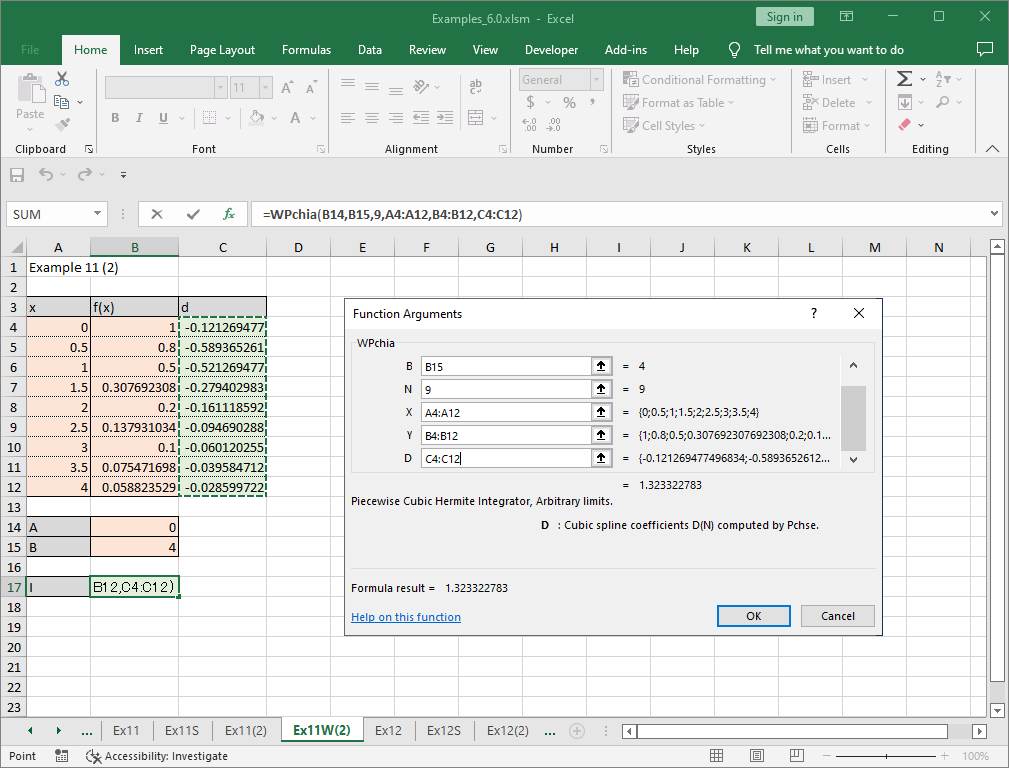
Executing this function yields 1.61082…, achieving three-digit accuracy from nine data points.
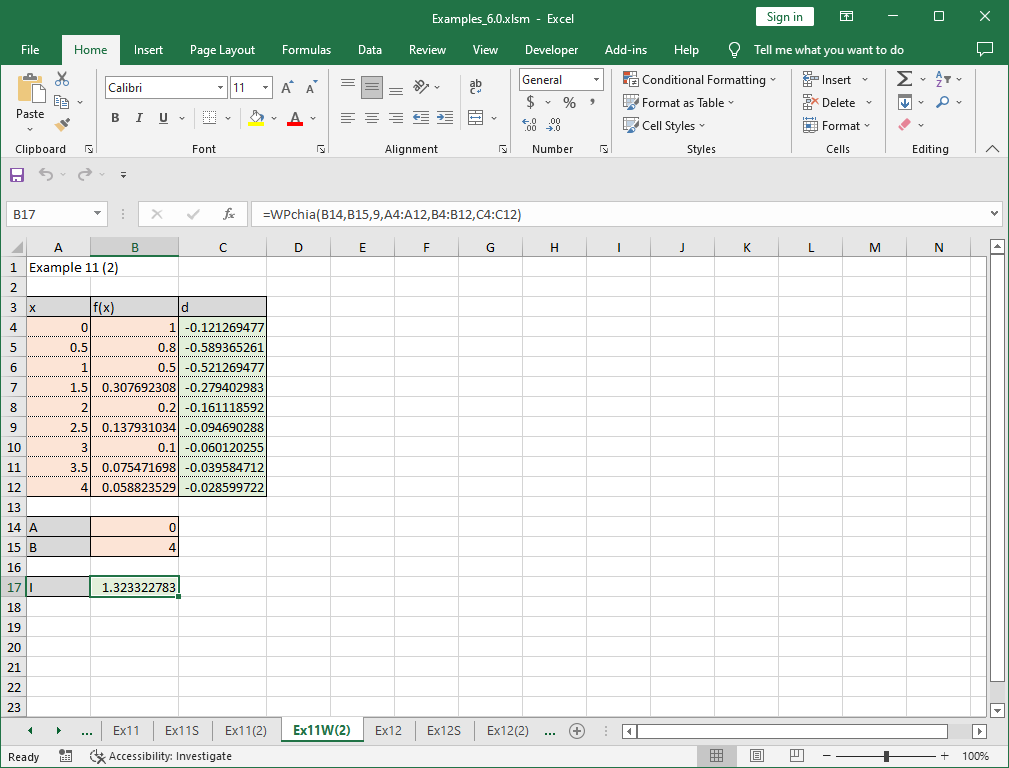
Note – The example worksheet also includes an integration example using spline interpolation with VBA.
11.3.4 How To Solve Using the Solver
You can also solve it using the “Quadrature (Finite Interval)” feature of the XLPack Solver Add-in. The integrand function (=1/(1+B3^2)) is entered in cell B4.
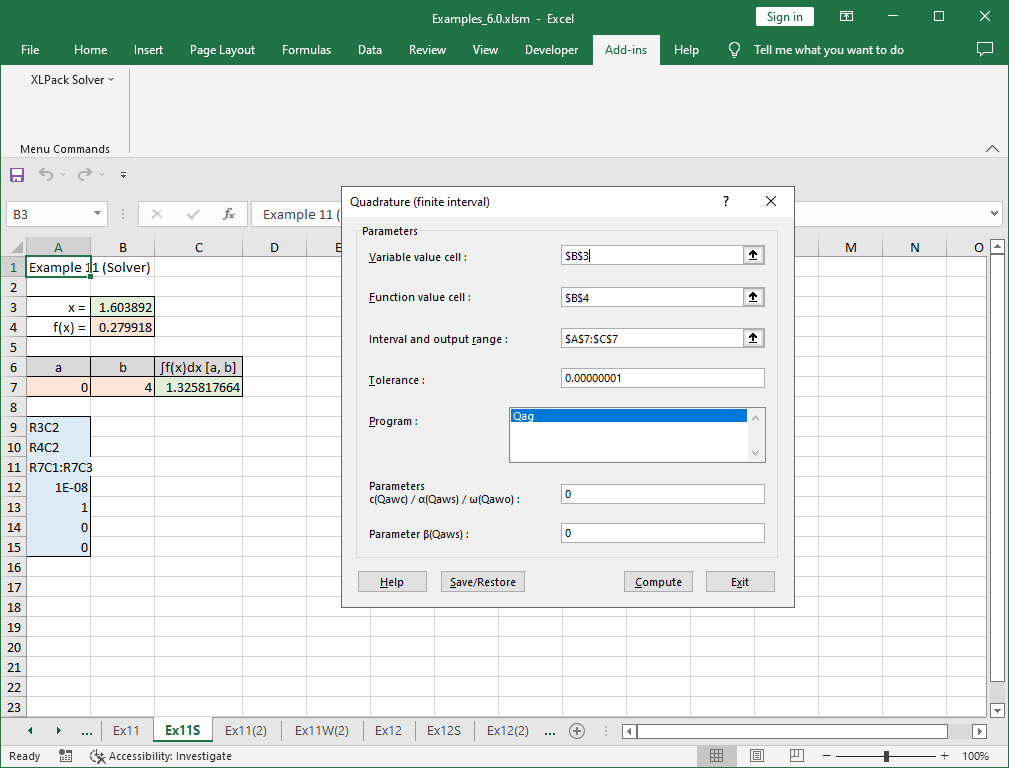
For more information about the solver, refer to this link.


